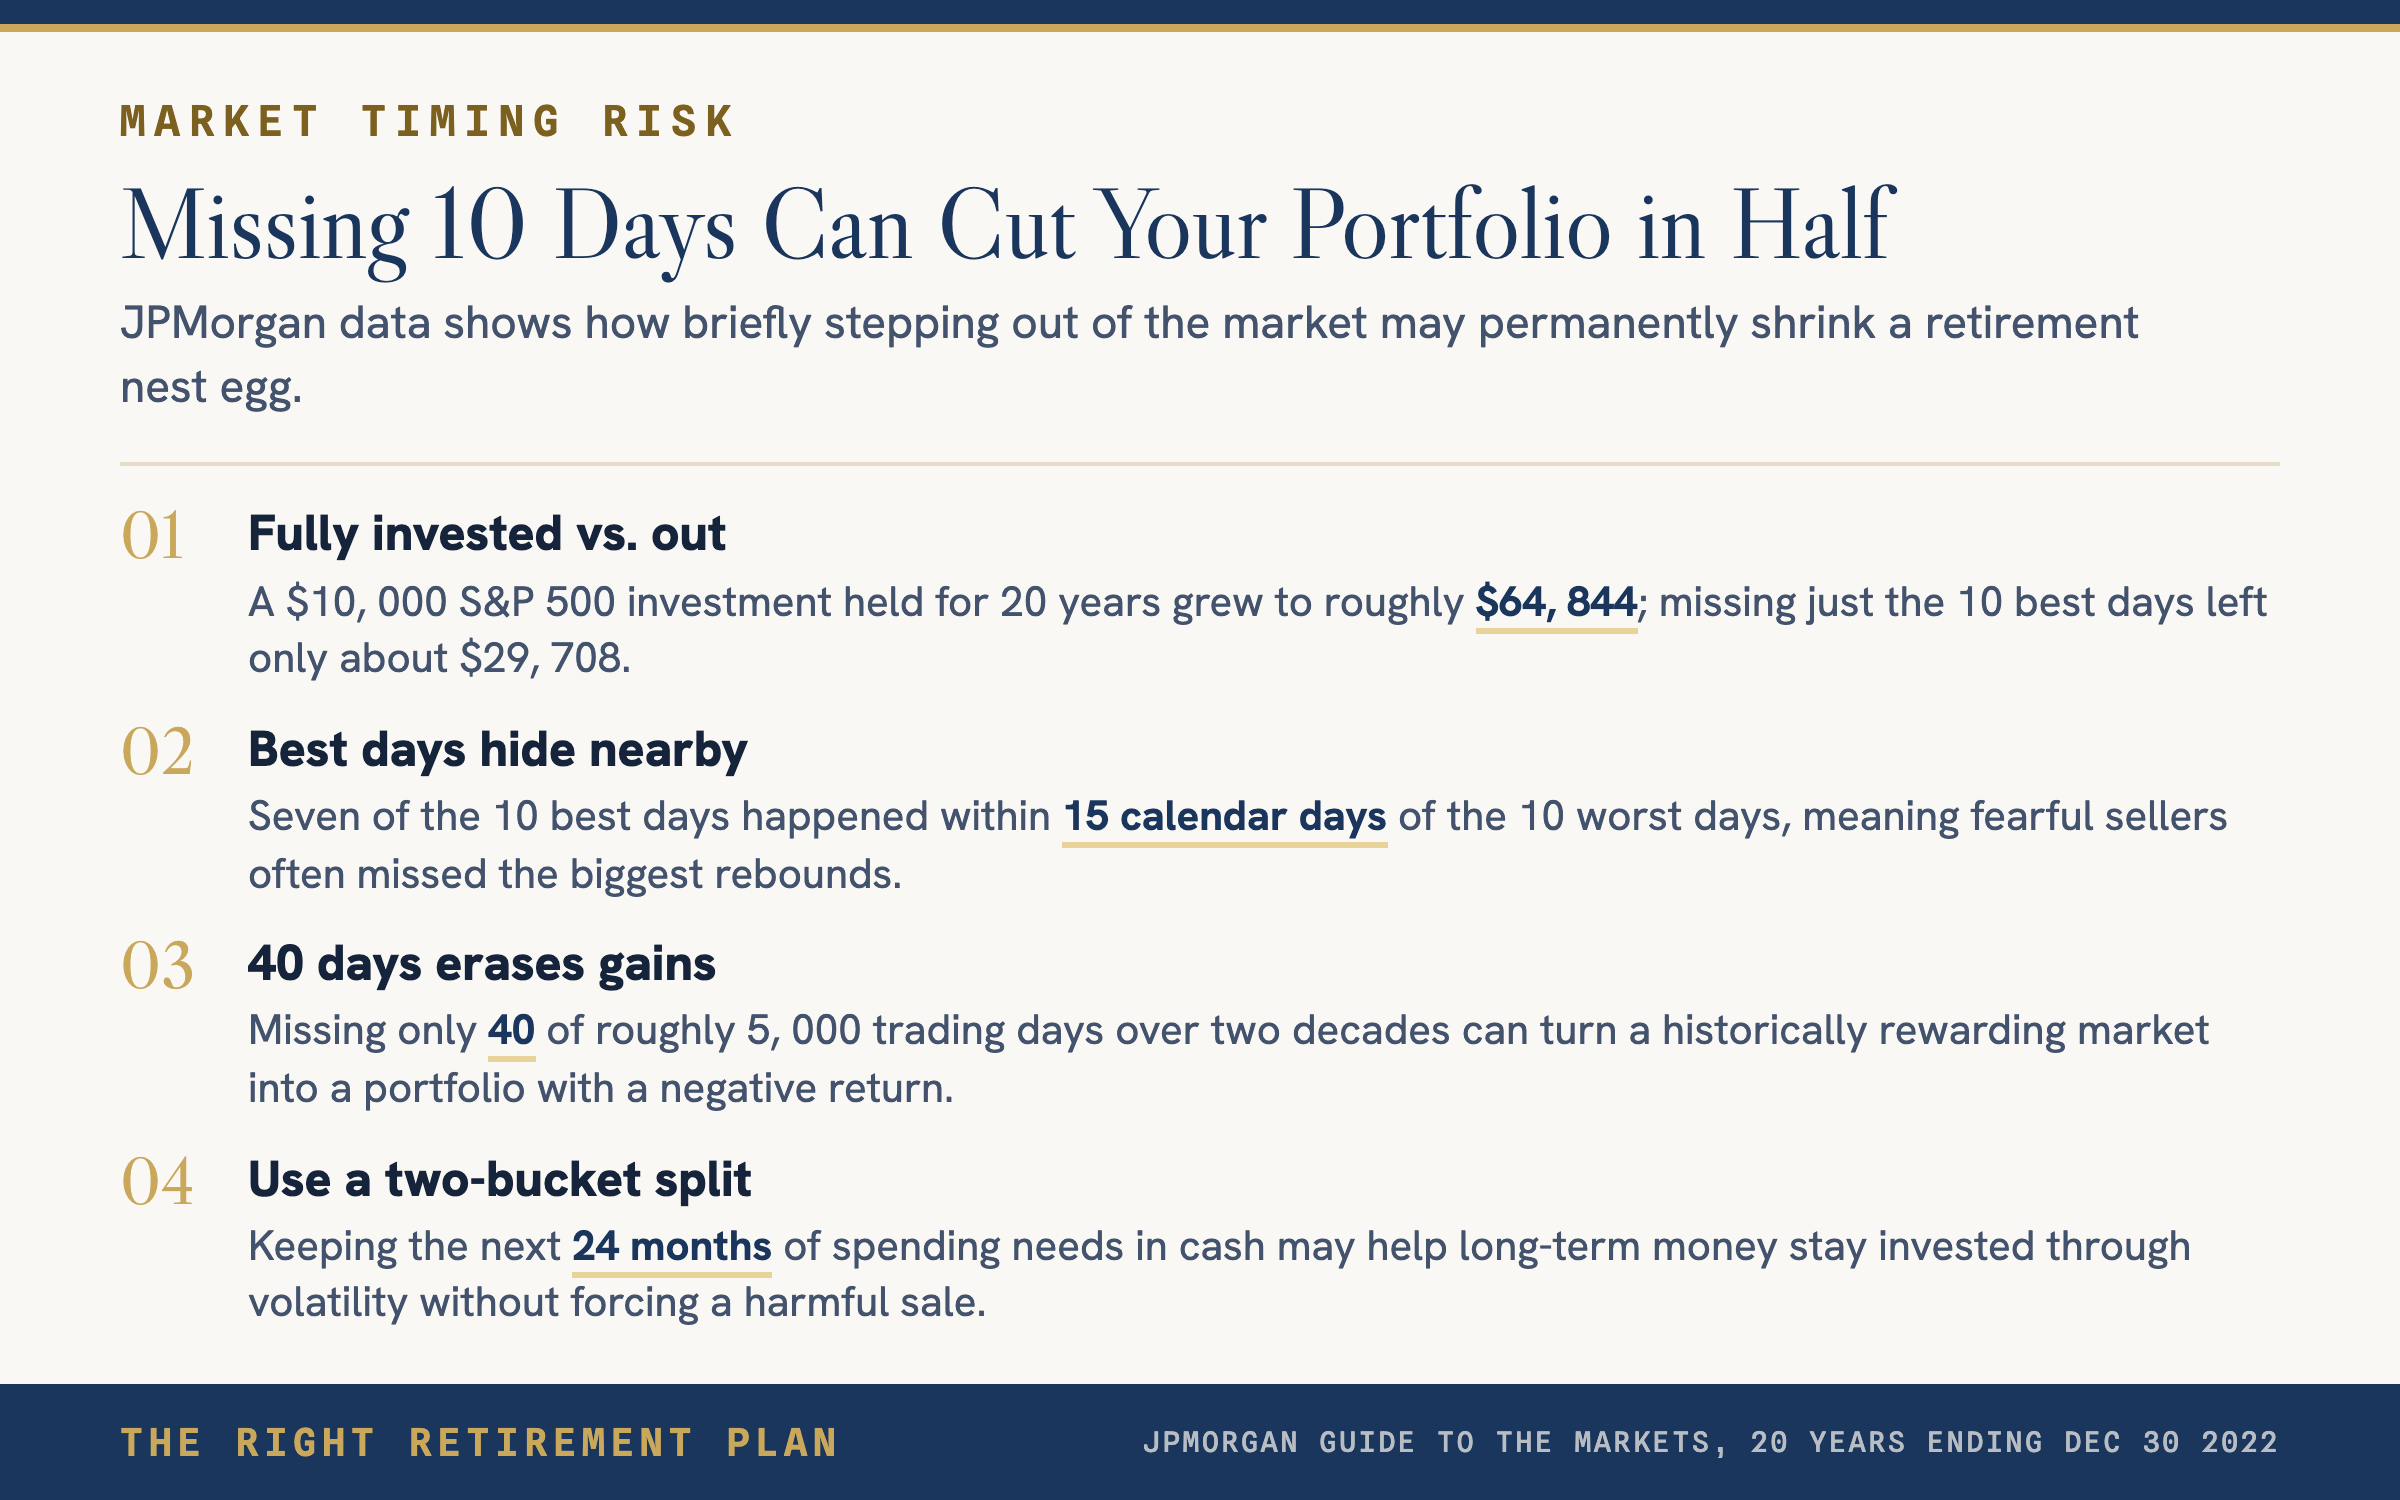
Forty days. Out of roughly five thousand trading days in the last twenty years. That is what it would have taken to turn the best-performing major asset class in modern history into a portfolio that lost money.
If you have been watching the headlines this week and asking whether you should step aside for a few weeks until things settle, you are not alone. It is the most common question pre-retirees ask about their portfolios. It is also the question that has cost retirement portfolios more money than any single product or fee in modern investing history.
Here is the math worth committing to memory.
What the JPMorgan study actually found
JPMorgan Asset Management's Guide to the Markets runs an analysis worth revisiting every year. They take a $10,000 investment in the S&P 500 over a twenty-year window and ask one question: what happens to your ending balance based on how many of the best days you missed?
Over the twenty years ending December 30, 2022, a $10,000 portfolio that stayed fully invested grew to roughly $64,844. That is an annualized return of about 9.8%.
The same $10,000, with just the ten best days missed, finished at about $29,708. The annualized return drops to roughly 5.6%. More than half of the ending balance was gone.
- Miss the 20 best days → ~$17,826 (2.9% annualized)
- Miss the 30 best days → ~$11,701 (0.8% annualized)
- Miss the 40 best days → ~$8,048 (negative annualized return)
Why the best days hide near the worst
The trap is not just that the best days are powerful. It is where the best days hide.
In that same JPMorgan analysis, seven of the ten best days happened within fifteen calendar days of the ten worst days. They sit on top of each other. The big up day arrives when the headlines are still screaming, when the chart still looks broken, when nobody on the news is telling you it is safe yet. The investor who got scared into selling on the worst day is almost guaranteed to be in cash for the best day. That is not a fluke of any particular cycle. That is the texture of every cycle anyone has studied.
This is the central reason that "I will just wait until things settle down and get back in" sounds like prudent risk management and behaves like a permanent paycut to your retirement.
What disciplined investing actually looks like
The discipline that captures the long-run return is not glamorous. It does not look smart on a Tuesday afternoon when the S&P is down two percent and the bond market is doing something strange. It looks like this:
- A disciplined plan raises cash on a schedule, against a known liability. It does not raise cash because the news got loud.
- A disciplined plan rebalances into weakness. When stocks fall harder than bonds, the rebalance buys stocks with bond proceeds. The plan is a net buyer of fear, not a net seller.
- A disciplined plan separates the money that pays the bills in the next 24 months from the money that grows for the next twenty years. The first bucket should never have been in equities. The second bucket should never have been in cash.
- A disciplined plan is written down in a quiet moment, so it can be read back in a loud one.
What to do if you are reading this with a tight chest
If you are reading this with a tight chest, the move is to call your advisor before you email your custodian. If you do not have an advisor, the move is to step away from the screen for the rest of the trading day. Your plan should be written for moments like this. If it is not, the time to write it is the next quiet Saturday morning, not Tuesday afternoon while the market is open.
For now, the work is to keep the money working.
Frequently asked questions
Is it ever a good idea to go to cash when the market drops?
For long-term retirement money, the historical answer has been no. Cash is the right tool for short-horizon liabilities (the next 24 months of spending). For money you do not need to spend for ten or twenty years, the cost of missing the rebound has historically been far higher than the cost of riding through the drawdown.
What if I just miss the worst days instead of trying to catch the best?
The same JPMorgan analysis showed that missing the worst days while staying invested would have outperformed staying fully invested. The problem is that no one has ever shown a reliable way to identify the worst days in advance. Every investor who has tried has eventually missed best days instead.
How often does the market actually have a 10%+ correction?
On average, the S&P 500 has had at least one decline of 10% or more in roughly every other calendar year since 1980. The average peak-to-trough drawdown inside a single calendar year has been about 14%. The fact that markets still finish positive in about three out of four years despite that volatility is the entire reason patient capital has been rewarded.
Where can I see the JPMorgan data myself?
JPMorgan publishes the Guide to the Markets quarterly. The "Impact of being out of the market" slide is in every edition. Searching for that phrase plus "JPMorgan Guide to the Markets" will return the most recent version.